Graduation and Retention Data
The table and charts below illustrate enrollment, retention rates, graduation rates, and times to degree for Scripps Research's Graduate Program. Also included below are disaggregated data pertaining to gender, ethnicity, citizenship, and campus location.
To view a larger image of the data table below, click on the table image and it will open a larger version in a separate window or tab. All other charts on this page are interactive. If you are on a desktop, hover your pointer over different parts of the chart for detailed information. If you are viewing this on a mobile device, charts will resize for better viewing and interaction if you rotate your device to a landscape (horizontal) orientation. To filter chart data and update your view, use any of the drop-down selectors at the top of each chart.
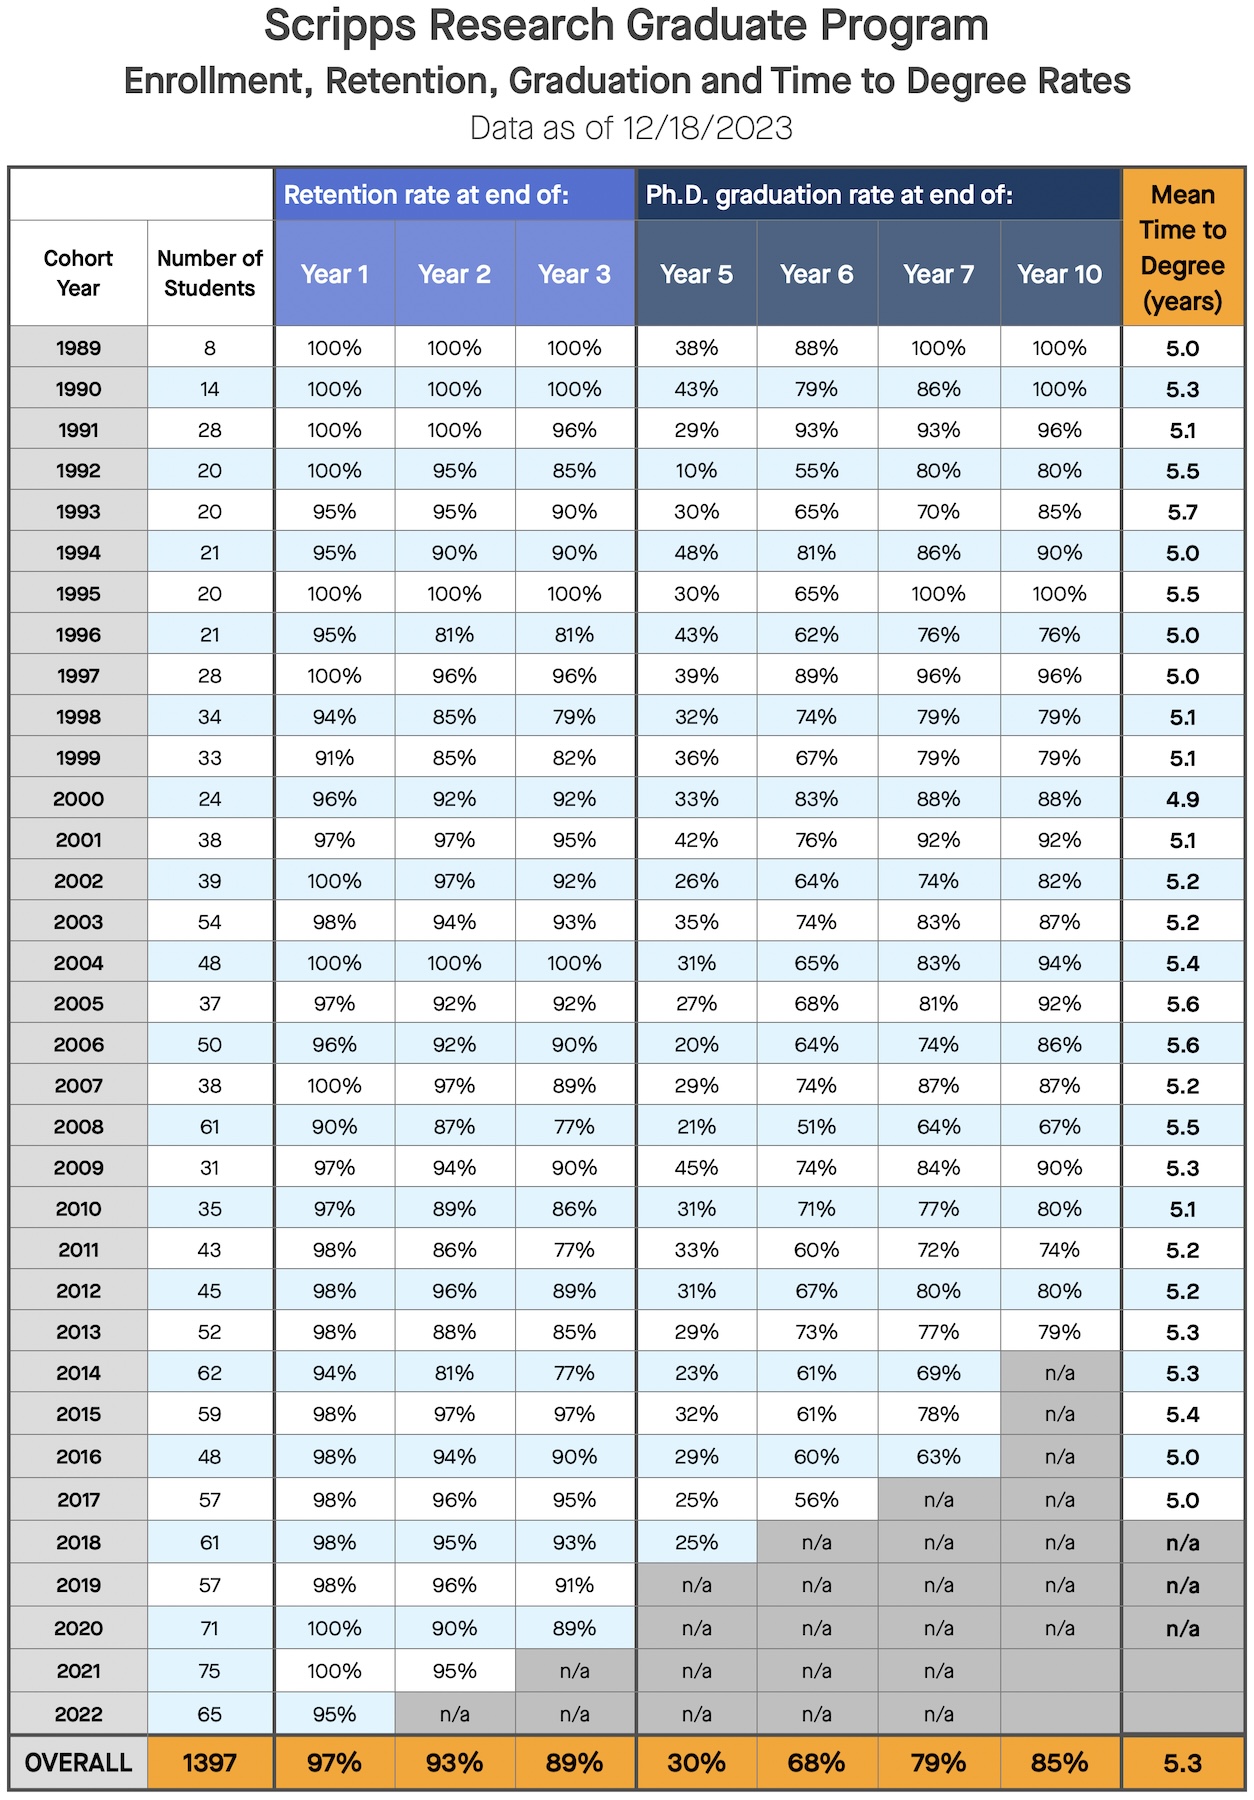
Enrollment, Retention, Graduation and Time to Degree
|
|
| The chart above illustrates key student success metrics, listed by the year each cohort (group) of students began their graduate studies. Cohorts of students typically begin graduate studies in August. For each cohort, we measure retention rate, or the percentage of each cohort that is still pursuing graduate studies after one, two or three years have elapsed since they began. Graduation rate measures the percentage of each cohort that has completed graduate studies by the time five, six, seven, and 10 years have elapsed since they began. Mean time to degree is the average time required for the students in a given cohort to complete graduate studies |
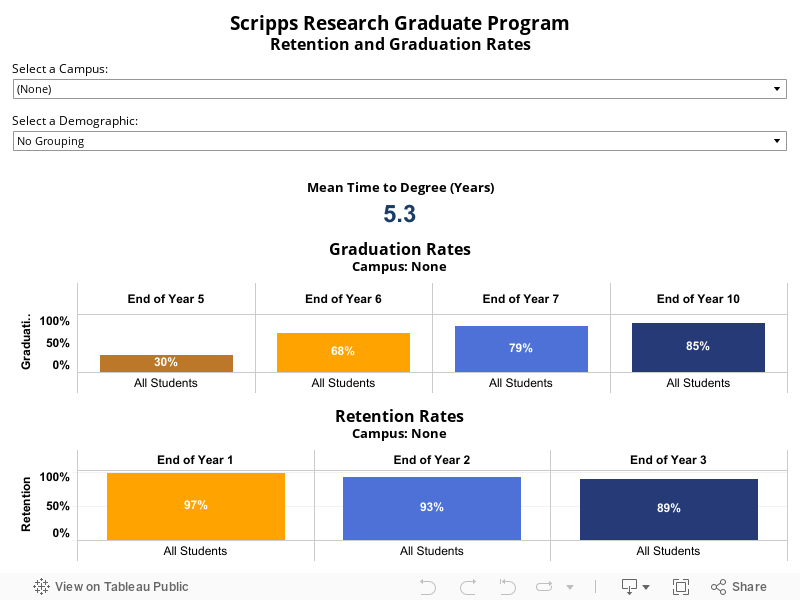
Graduation and Retention Rates by Campus, Gender and Citizenship
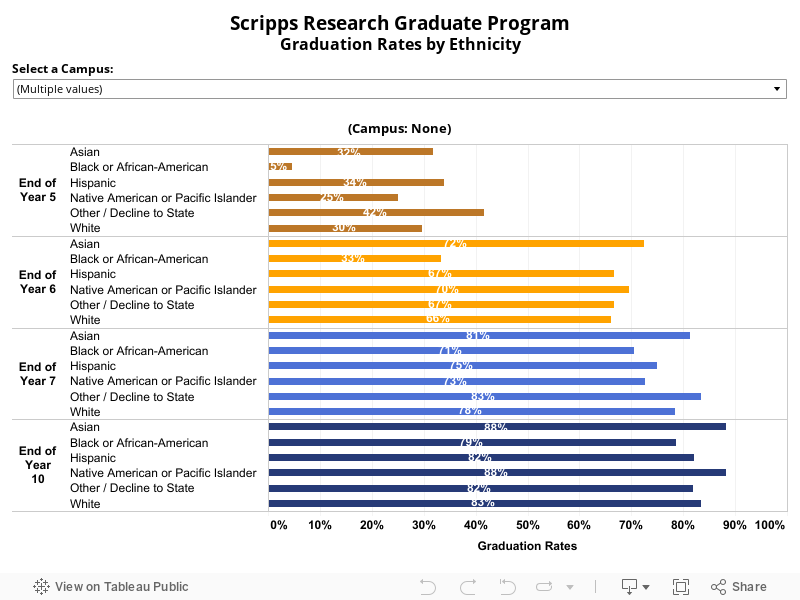
Graduation Rates by Ethnicity
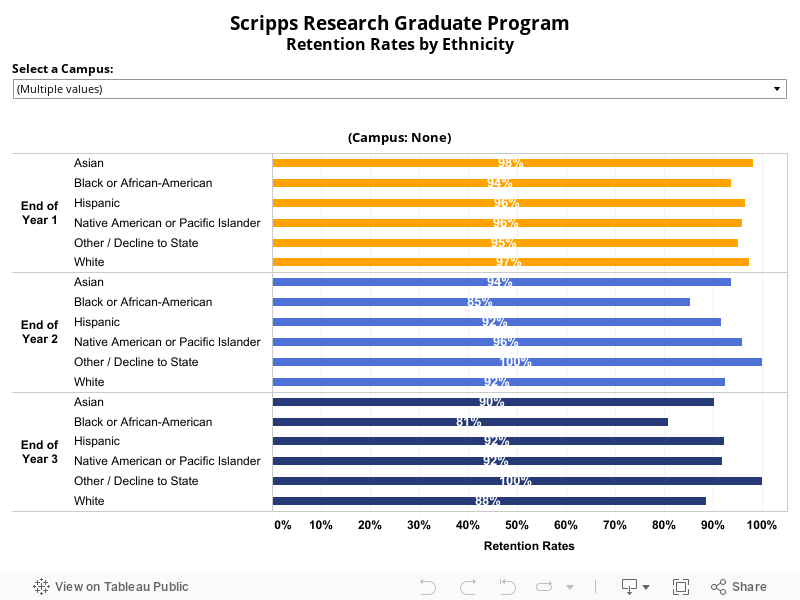
Retention Rates by Ethnicity